Young crust at mid-ocean ridges
New oceanic crust forms at spreading ridges. The youngest mapped ages therefore tend to follow active ridge axes, including the Mid-Atlantic Ridge.
Compare the ages of oceanic crust with spreading ridges and plate margins.
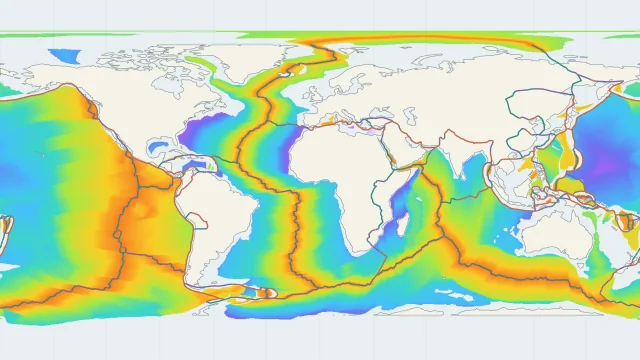
Click ocean floor to read its age in the published model.
New oceanic crust forms at spreading ridges. The youngest mapped ages therefore tend to follow active ridge axes, including the Mid-Atlantic Ridge.
Crust generally grows older away from a ridge, but spreading changes, transform offsets and subduction complicate the pattern. Distance from the nearest coast is not a reliable age measure.
An age grid describes when oceanic crust formed, usually in millions of years. It does not measure water depth or the age of sediment lying above the crust; blank areas can reflect the dataset mask.
Plate outlines use Peter Bird's PB2002 model, distributed by Nordpil under the Open Data Commons Attribution licence. Coastlines and country outlines are Natural Earth public-domain data. Boundary detail is limited by the source model. Ocean-floor ages use Seton et al. (2020), dataset v1.1, CC BY 4.0. The display samples the source grid at 0.25-degree pixel centres; blank cells have no age value.
Country lookup compares simplified land outlines with the plate model. Boundaries and historical coastlines are modelled features. This atlas explains geography; it does not predict earthquakes or provide site-specific hazard estimates.