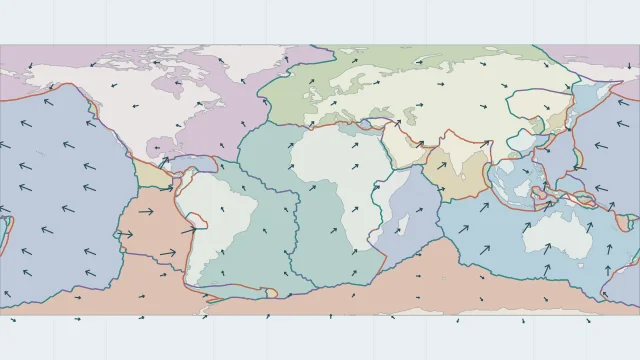
Read plate motion arrows
The arrows show MULLER2019 rigid-plate velocities averaged from 1 million years ago to the present, in a mantle reference frame. Colours separate speed ranges in millimetres per year. Arrow lengths are enlarged for readability; they are not annual travel distances.
Relative motion and reference frames
Motion is measured relative to something: another plate, a global plate system or a mantle-based frame. Two arrows from different frames cannot be compared as if they share one fixed background.
Compare modelled speeds
A plate rotates on a sphere, so its surface speed varies with location. A number at one point is not a universal speed for every point on that plate. These are model averages rather than GPS observations, and do not resolve local deformation within a plate.
Sources and map method
Plate outlines use Peter Bird's PB2002 model, distributed by Nordpil under the Open Data Commons Attribution licence. Coastlines and country outlines are Natural Earth public-domain data. Boundary detail is limited by the source model. Motion vectors use MULLER2019 finite rotations from 1 Ma to the present, mantle reference frame, CC BY 4.0. They are rigid-plate model averages, not GPS observations. Arrows are enlarged for visibility.
Country lookup compares simplified land outlines with the plate model. Boundaries and historical coastlines are modelled features. This atlas explains geography; it does not predict earthquakes or provide site-specific hazard estimates.